Here we filter allele frequencies with a beta mixture model that contains 5 mixtures: three mixtures representing cytotypes included in nQuack and two mixtures representing a U-shaped distribution. We constrained the first three mixtures to have shape and scale parameters above 1, while the last two mixtures shape and scale are constrained to be less than 1. With this implementation of expectation-maximization, we utilizes the scaled probability of each data point belonging to each mixture model to remove site where the probability of belonging to a U-shaped mixture is higher than the probability of belonging to any other mixture. Due to the computational time needed to run the expectation-maximization algorithm, by default, we simple calculate this probability matrix with the E-step and do not run the complete algorithm.
Arguments
- xm
Matrix with total coverage and coverage for a randomly sampled allele.
- plot
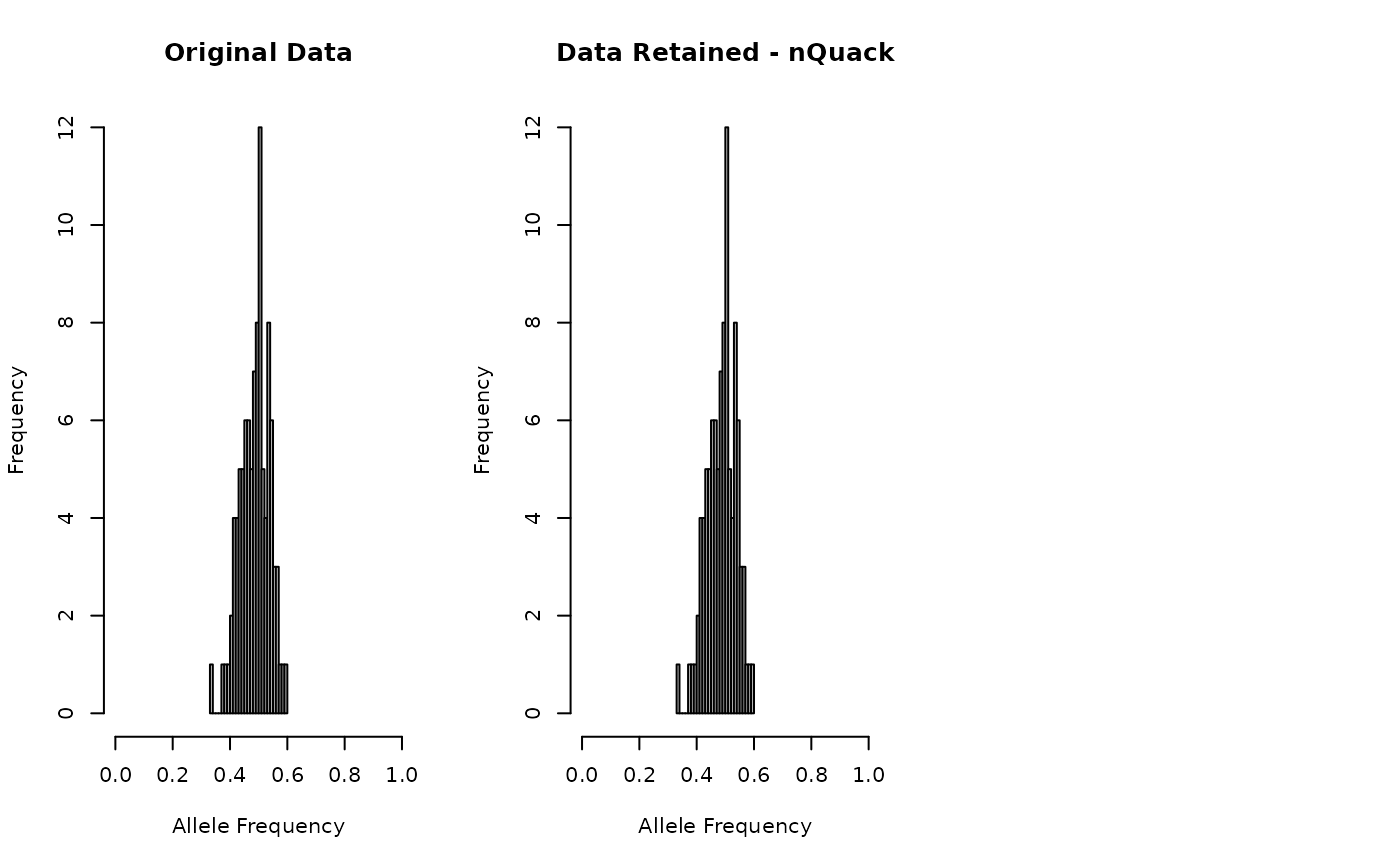
Default to TRUE. The plots do not share the same y-axis, so careful interpretation is key. Warning, if nothing is removed, the plot of removed data will be missing.
- quick
Default to TRUE. If set as FALSE, the expectation-maximization algorithm will be run in full.